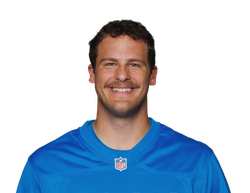
 Detroit Lions · TE · TE7 on the season · 7 games
The read
Sam LaPorta has 85.9 PPR points in 7 games (12.3 per game) for the Detroit Lions. He is the TE7 on the season.
He is on the field for 93% of his team's snaps.
Lately his yards after catch per reception is up: 8.0 recently against 4.5 earlier this season.
The rest of his schedule grades middling: his remaining opponents average rank 18.4 against TEs (rank 1 gives up the most points), with the softest spot in Week 11 against TB.
Usage
| Snap share | 93% (was 88%) |
| Target share | 15% (was 19%) |
| Carry share | 1% (was 0%) |
| Air yards share | 12% (was 14%) |
| Red-zone target share | 29% (was 21%) |
Recent form against his own earlier-season baseline, same games window the app uses.
This week's matchup
The collision score measures how strongly his usage runs into this defense's weak spots. Higher means the matchup leans his way.
By quarterback
| Passer | Games | Targets | Yards | Target share |
|---|---|---|---|---|
| Jared Goff | 7 | 44 | 367 | 100% |
Sims for his next game
Simulation percentages for his next game, showing the line closest to a coin flip per market. Sims are estimates, not predictions. How they are made: the method page.
Rest of season · Weeks 10–14
 WK 10vs NE23
 WK 11vs TB11
 WK 12vs CHI22
 WK 13@ ATL16
 WK 14vs TEN20
Game log
| Wk | Opp | Snap % | Tgt | Air yds | RZ touches | PPR |
|---|---|---|---|---|---|---|
| 1 | NO | 81% | 8 | 7 | 2 | 9.8 |
| 2 | BUF | 98% | 7 | 23 | 2 | 17.2 |
| 3 | NYJ | 92% | 4 | 39 | 1 | 7.4 |
| 4 | CAR | 79% | 13 | 119 | 4 | 22.4 |
| 5 | ARI | 89% | 5 | 44 | — | 19.8 |
| 7 | GB | 97% | 2 | 11 | 1 | 2.8 |
| 8 | MIN | 93% | 5 | 24 | 1 | 6.5 |
Season stats
Rushing
| TDs | 0 |
| Yards | 2 |
| Carries | 1 |
Receiving
| TDs | 3 |
| Yards | 367 |
| Targets | 44 |
| Receptions | 31 |
All splits and stats (8)
| Contested target rate | 17% (was 16%) |
| Drop rate | 0% (was 0%) |
| Screen target share | 4% (was 5%) |
| Target share with motion | 43% (was 74%) |
| Target share without play action | 74% (was 37%) |
| Target share on play action | 26% (was 63%) |
| Yards after catch per reception | 8.0 (was 4.5) |
| Yards per route run | 0.72 (was 0.94) |
The deeper cuts the normal box score never shows: how he is used by formation, coverage, box count, and situation, each against his own earlier-season baseline.
Data: 2026 season, Week 10 board · computed Nov 3, 4:38 PM EST. Stats are computed by OnlySports from play-by-play data (nflverse, CC-BY-SA 4.0).