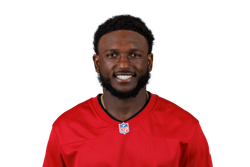
 Tampa Bay Buccaneers· WR · WR58 on the season · 8 games
The read
Chris Godwin Jr. has 53.1 PPR points in 8 games (6.6 per game) for the Tampa Bay Buccaneers. He is the WR58 on the season.
His role is real: he owns a 33% share of his team's targets.
Lately his yards after catch per reception is up: 7.5 recently against 6.1 earlier this season.
One wrinkle: most of Chris's targets this season came from Jalon Daniels, but Baker Mayfield is expected to be throwing this week, and his numbers have differed by quarterback.
Usage
| Snap share | 82% (was 82%) |
| Target share | 33% (was 15%) |
| Carry share | 0% (was 2%) |
| Air yards share | 11% (was 7%) |
Recent form against his own earlier-season baseline, same games window the app uses.
By quarterback
His quarterback changed. Most of his targets came from Jalon Daniels, but Baker Mayfield is expected to throw this week. His splits by passer:
| Passer | Games | Targets | Yards | Target share |
|---|---|---|---|---|
| Jalon Daniels | 3 | 18 | 105 | 51% |
| Baker Mayfield | 5 | 17 | 138 | 49% |
Sims for his next game
 CHI10% (OnlySports sims)CHI51% (OnlySports sims)CHI57% (OnlySports sims)CHI21% (OnlySports sims)
Simulation percentages for his next game, showing the line closest to a coin flip per market. Sims are estimates, not predictions. How they are made: the method page.
Game log
| Wk | Opp | Snap % | Tgt | Air yds | RZ touches | PPR |
|---|---|---|---|---|---|---|
| 1 |  CIN | 86% | 4 | 3 | — | 8.3 |
| 2 |  CLE | 86% | 3 | 33 | — | 8.8 |
| 3 |  MIN | 62% | 4 | 16 | — | 5.5 |
| 4 |  GB | 89% | 7 | 16 | — | 9.1 |
| 5 |  DAL | 88% | 3 | 5 | 1 | 7.0 |
| 6 |  PIT | 92% | 8 | 54 | — | 7.7 |
| 7 |  CAR | 73% | 5 | -8 | 2 | 6.7 |
| 8 |  ATL | 82% | 1 | 16 | 1 | 0.0 |
Season stats
Rushing
| TDs | 0 |
| Yards | 18 |
| Carries | 3 |
Receiving
| TDs | 0 |
| Yards | 243 |
| Targets | 35 |
| Receptions | 27 |
All splits and stats (8)
| Contested target rate | 0% (was 6%) |
| Drop rate | 13% (was 0%) |
| Screen target share | 31% (was 22%) |
| Target share with motion | 69% (was 83%) |
| Target share without play action | 88% (was 72%) |
| Target share on play action | 13% (was 28%) |
| Yards after catch per reception | 7.5 (was 6.1) |
| Yards per route run | 0.39 (was 0.67) |
The deeper cuts the normal box score never shows: how he is used by formation, coverage, box count, and situation, each against his own earlier-season baseline.
Data: 2026 season, Week 10 board · computed Nov 3, 3:45 PM EST. Stats are computed by OnlySports from play-by-play data (nflverse, CC-BY-SA 4.0).